Blog

  • The 2027 Restaurant Tech Budget Is Already Written

    The 2027 Restaurant Tech Budget Is Already Written

    Somewhere this month, in a conference room or a Zoom window, 2027 budget discussions will commence, and the first thought is to look at 2026’s budget as a starting point. But there are other places to look. 

    The numbers that will decide what your 2027 technology budget can actually do are already published. Some of them were certified by a state agency in July. Others sit in a USDA table that updates on the 25th of every month. None of them require a forecast, a consultant, or a crystal ball. And once you account for them, the discretionary portion of that budget turns out to be a lot smaller than the line item everyone is staring at.

    Start with the ceiling, not the wish list

    Restaurant IT budgets now average 2.58 percent of revenue, according to Hospitality Technology’s 2026 Restaurant Technology Study. That figure gets quoted a lot, usually as evidence that the industry is finally taking technology seriously.

    The more useful number is buried right next to it. Sixty-six percent of that spend goes to maintaining solutions that already exist.

    Run the math. On a twenty-unit portfolio doing $2.5 million per store, 2.58 percent of revenue is about $1.29 million in annual technology budget. Two-thirds of that is committed before the planning meeting starts. What’s actually available for anything new is closer to $440,000, or roughly nine-tenths of one percent of revenue.

    That’s the real number. Every vendor conversation you have between now and December is competing for a slice of nine-tenths of a percent.

    Three numbers you can write down today

    The cost pressures shaping next year’s P&L aren’t a mystery, and they aren’t evenly distributed. Three of them are specific enough to put in a model right now.

    Food. The USDA’s Economic Research Service projects food-away-from-home prices rising 2.7 percent in 2027, with all food up 2.4 percent. The pressure underneath that average is concentrated: beef and veal are running up 9.8 percent this year, and wholesale beef 9.4 percent. If protein is a meaningful share of your menu mix, your 2027 food cost line moves well ahead of the headline number.

    Labor. California’s minimum wage rises to $17.40 on January 1, 2027, after the Department of Finance certified a 2.99 percent CPI adjustment in July. The state’s fast food minimum holds at $20. Most other indexed states will publish their January adjustments over the next several weeks, and if you operate across state lines, those dates are worth a calendar entry rather than a surprise.

    Wage drift everywhere else. Private-industry wages rose 3.1 percent for the twelve months ending June 2026, per the Bureau of Labor Statistics Employment Cost Index. That’s the number that moves your shift leads and general managers, the roles no minimum wage schedule touches.

    None of these are things to hedge against. They’re line items. You can put them in a spreadsheet this afternoon.

    The margin you’re budgeting against

    Here is the context that makes the budget conversation hard. The National Restaurant Association’s 2026 State of the Restaurant Industry found that 42 percent of operators reported their restaurant was not profitable last year. Industry sales are projected at $1.55 trillion with 1.3 percent real growth.

    Growth of 1.3 percent does not absorb food costs, up 2.7 percent, and wages up 3.1 percent. The gap has to come from somewhere, and for most portfolios it comes from throughput, check average, or waste.

    Which means the technology budget stops being defended on roadmap and starts being defended on return. Nobody is approving a platform because it’s modern.

    What most portfolios haven’t priced

    There’s one more thing sitting in the 2027 budget that a lot of operators haven’t fully accounted for. Forty-four percent of operators plan to replace or significantly upgrade their POS, according to Hospitality Technology’s 2026 POS Software Trends Study.

    For a lot of multi-unit operators, both of those decisions land in the same budget year, pulling from the same small pot. And they’re tangled together. The reason two-thirds of the budget goes to upkeep is that most operators bought their systems one at a time and figured out how to connect them later.

    So the order you do things in matters more than what you buy. Before you commit to anything customers touch, you need to know where the POS is headed. If the plan is to sort out the connections afterward, that’s how the upkeep line gets to two-thirds in the first place.

    What clears approval

    The requests that get funded and the requests that get deferred tend to differ in one specific way. The funded ones show a payback the finance team can verify inside the fiscal year, using the operator’s own transaction data rather than a vendor’s blended average.

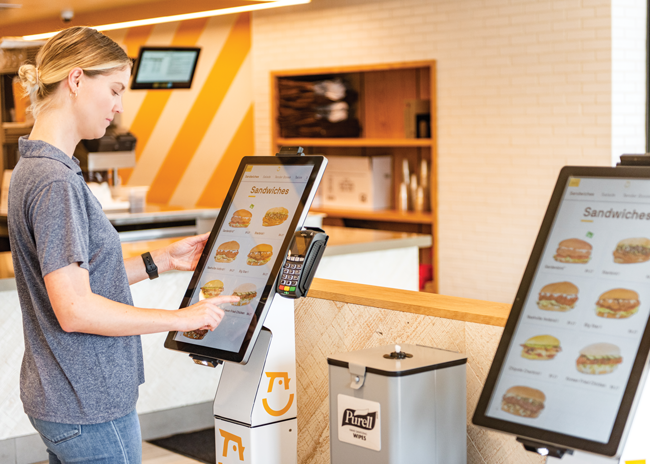
    For self-order kiosks, two lines carry that argument, and both are auditable against a POS export. The first is check average on kiosk orders versus employee-taken orders in the same store and same daypart. The second is order accuracy, which shows up as comps and refunds and is usually undercounted because nobody assigns it a dollar figure.

    Build from the floor up

    The instinct in September is to open last year’s budget and work down from it. The better exercise is to build from the cost floor up: write down the three inputs you already know, subtract the maintenance commitment, and see what’s genuinely left.

    Then ask the only question that survives that exercise. Of everything on the list, which single investment pays back before the fiscal year closes?
  • Why the Kiosk Is the Best Place to Answer “Can I Eat This?”

    Why the Kiosk Is the Best Place to Answer “Can I Eat This?”

    A guest with a sesame allergy walks up to your counter at 12:40 on a Tuesday. She has three options: interrogate a 19-year-old cashier who has eleven cars in the drive-thru and a headset in one ear, guess, or leave.

    Most of them leave. And the industry is paying for it. 

    Restaurants are forfeiting an estimated $12.6 billion a year because allergen information is vague, buried, or missing, according to a Nutritics 2026 Allergy Dining Report. That works out to roughly $78 per table that walks.

    For years, dietary and allergen accommodation lived in the hospitality column. It was something a good manager did well and a bad one improvised. That’s over. It’s now a purchase filter your guests apply before they ever reach your door, and it belongs in the technology column. Specifically, on the kiosk.

    The expectation has shifted, and the data backs it up

    Ask allergy-affected diners what they want, and the answer is boring in the best way. 

    According to the report, 54 percent look for explicit allergen labeling beside every menu item. Thirty-seven percent want an online menu they can filter.

    When they can’t find it, they don’t call ahead to ask. Ninety-five percent have simply abandoned a planned visit because clear allergen details weren’t easy to access. Fifty-one percent have switched to a different restaurant that made it easier. And 61% have skipped eating out altogether, staying home rather than navigating the stress of finding a safe option.

    Read that last number again. These aren’t guests you lost at the register. They’re guests who never considered you.

    That’s the part operators consistently underestimate. A remake or a comped entrée is visible. It shows up in waste or in comp reports. A guest who quietly chose the place down the street because that brand’s app let her tap “no tree nuts” shows up nowhere at all. The cost is real. 

    “Dietary” got a lot bigger than allergens

    Meanwhile, the definition of a dietary restriction has expanded well past the nine major allergens.

    A lot of guests now read a menu hunting for protein the same way an allergic guest reads it hunting for peanuts. Sixty-two percent of consumers actively look for high-protein options on a menu, 38 percent will pay more for them, and nearly half say they’d switch restaurant brands to get them, according to Revenue Management Solutions survey data reported by Nation’s Restaurant News. 

    About 23 percent of U.S. households now include someone on a GLP-1 medication, and fiber is tracking the same curve, with 45 percent looking for high-fiber options and 34 percent willing to switch brands to find them.

    Chains have responded fast on the product side. Chipotle’s High Protein–High Fiber Bowl, Sweetgreen’s functional health menu, and Starbucks’ protein beverage line are great examples.

    The food exists, but finding it is the problem.

    Brands are building increasingly segmented menus and then presenting them on the same static menu board they used in 2015. A guest tracking protein and a guest avoiding dairy are looking at the same nine backlit panels, doing the same mental math, and reaching the same conclusion. 

    Compliance stopped being optional on July 1, 2026

    The law moved too. California’s ADDE Act (SB 68) took effect July 1, requiring restaurants with 20 or more locations nationally to disclose the top nine allergens in each menu item. It’s the first U.S. law to put allergens on menus.

    Per Food Safety Magazine, operators can satisfy it three ways: directly on the menu, in a digital format such as a QR code, or on a separate allergen menu or chart. Digital counts, but if you go digital, you also need a non-digital alternative for guests who can’t access it.

    And California won’t be the last. The Asthma and Allergy Foundation of America is now working on restaurant allergen-labeling bills in Maryland, New Jersey, Illinois, Ohio, Missouri, New York, and Michigan. Virginia has already passed its own version: Senate Bill 183, signed in April and effective the same day as California’s, requires restaurants to put an identifying marker on any delivery or takeout item that was altered or substituted for a customer-identified allergy. Operators building for one state are building for all of them.

    So most multi-unit operators are doing this work regardless. The only question is whether they do the minimum and eat the cost, or put the same work somewhere it sells food. If you’re going to catalog every ingredient in every item anyway, burying the result in a PDF is a strange choice.

    The kiosk isn’t just a good place for this—It’s the right one

    Four reasons, and none of them are about liking one vendor over another.

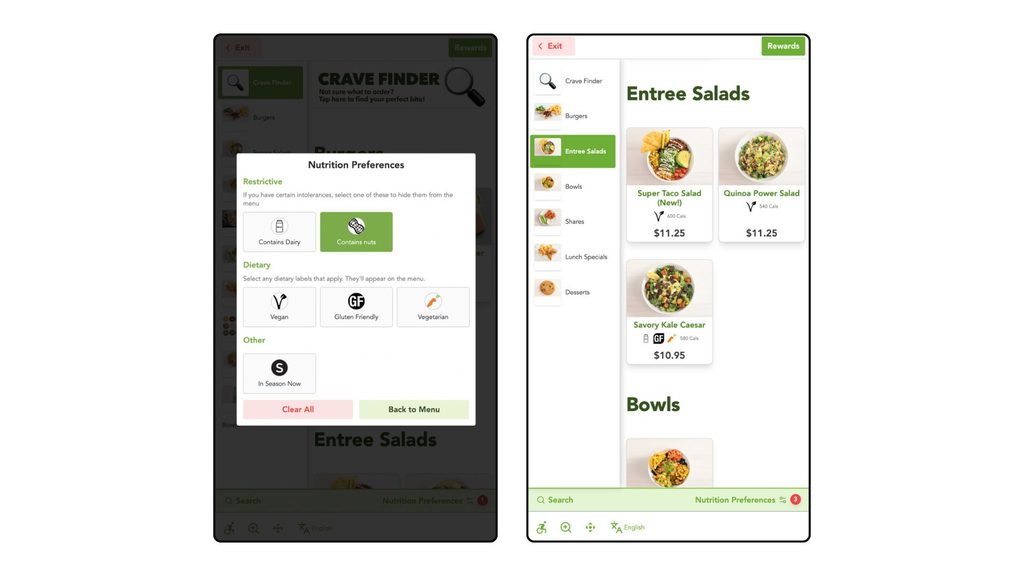
    • There’s room to say more. A menu board is one fixed piece of wall, which is why allergen details always lose the fight against the photo of the burger. A kiosk has as many screens as it needs. Full allergen and nutrition information can sit one tap behind every item without shrinking anything else.
    • Nobody has to disclose a medical condition to a stranger. This is the underrated one. A kiosk lets a guest filter privately, at their own pace, without narrating their health history over a counter to someone they’ll never see again. 
    • The filter catches the mistake before it happens. A guest can set their restrictions when they start the order, and unsafe items get flagged or hidden right there on screen. You prevent the wrong order instead of remaking it.
    • One update, every store, same day. Change an ingredient once, and every kiosk in every market shows the change immediately. That matters when seven states are each writing their own disclosure rules. The alternative is reprinting menu inserts for 300+ locations.

    And none of this slows the line. 

    What good looks like—and where operators get it wrong

    The most common mistake is a PDF allergen chart behind a QR code. Technically compliant, however, useless in practice. It asks a guest to stop ordering, pinch-zoom a spreadsheet on their phone, cross-reference it themselves, and then come back.

    The better fix is a filter that keeps working all the way through the order—modifiers, combos, add-ons, everything. A filter that handles entrées and then quietly gives up at the sauce is worse than no filter at all, because by then the guest trusts it.

    Best is filtering that sells. Don’t just subtract the unsafe items; surface the item they can have, including the premium one. A guest who walked in expecting to settle for a side salad and instead finds a protein bowl they trust spends more, not less. 

    One warning: filtering is only as trustworthy as your ingredient data. If your recipe records are stale or inconsistent across suppliers, a filter doesn’t reduce your risk—it formalizes it. Fix the data before you ship the feature.

    The guests you’re not losing

    No version of this goes backward. Allergen disclosure is becoming law, GLP-1 use keeps climbing, and the generation that grew up filtering everything from flights to streaming libraries is not going to start asking a cashier.

    The operators who win here won’t be the ones with the longest list of allergen-free items. They’ll be the ones who made those items effortless to find.

    Every filter you add is a guest you stop losing at the door.

  • Why College Dining Halls Are Going Kiosk-First — And What It Means for Brand Operators

    Why College Dining Halls Are Going Kiosk-First — And What It Means for Brand Operators

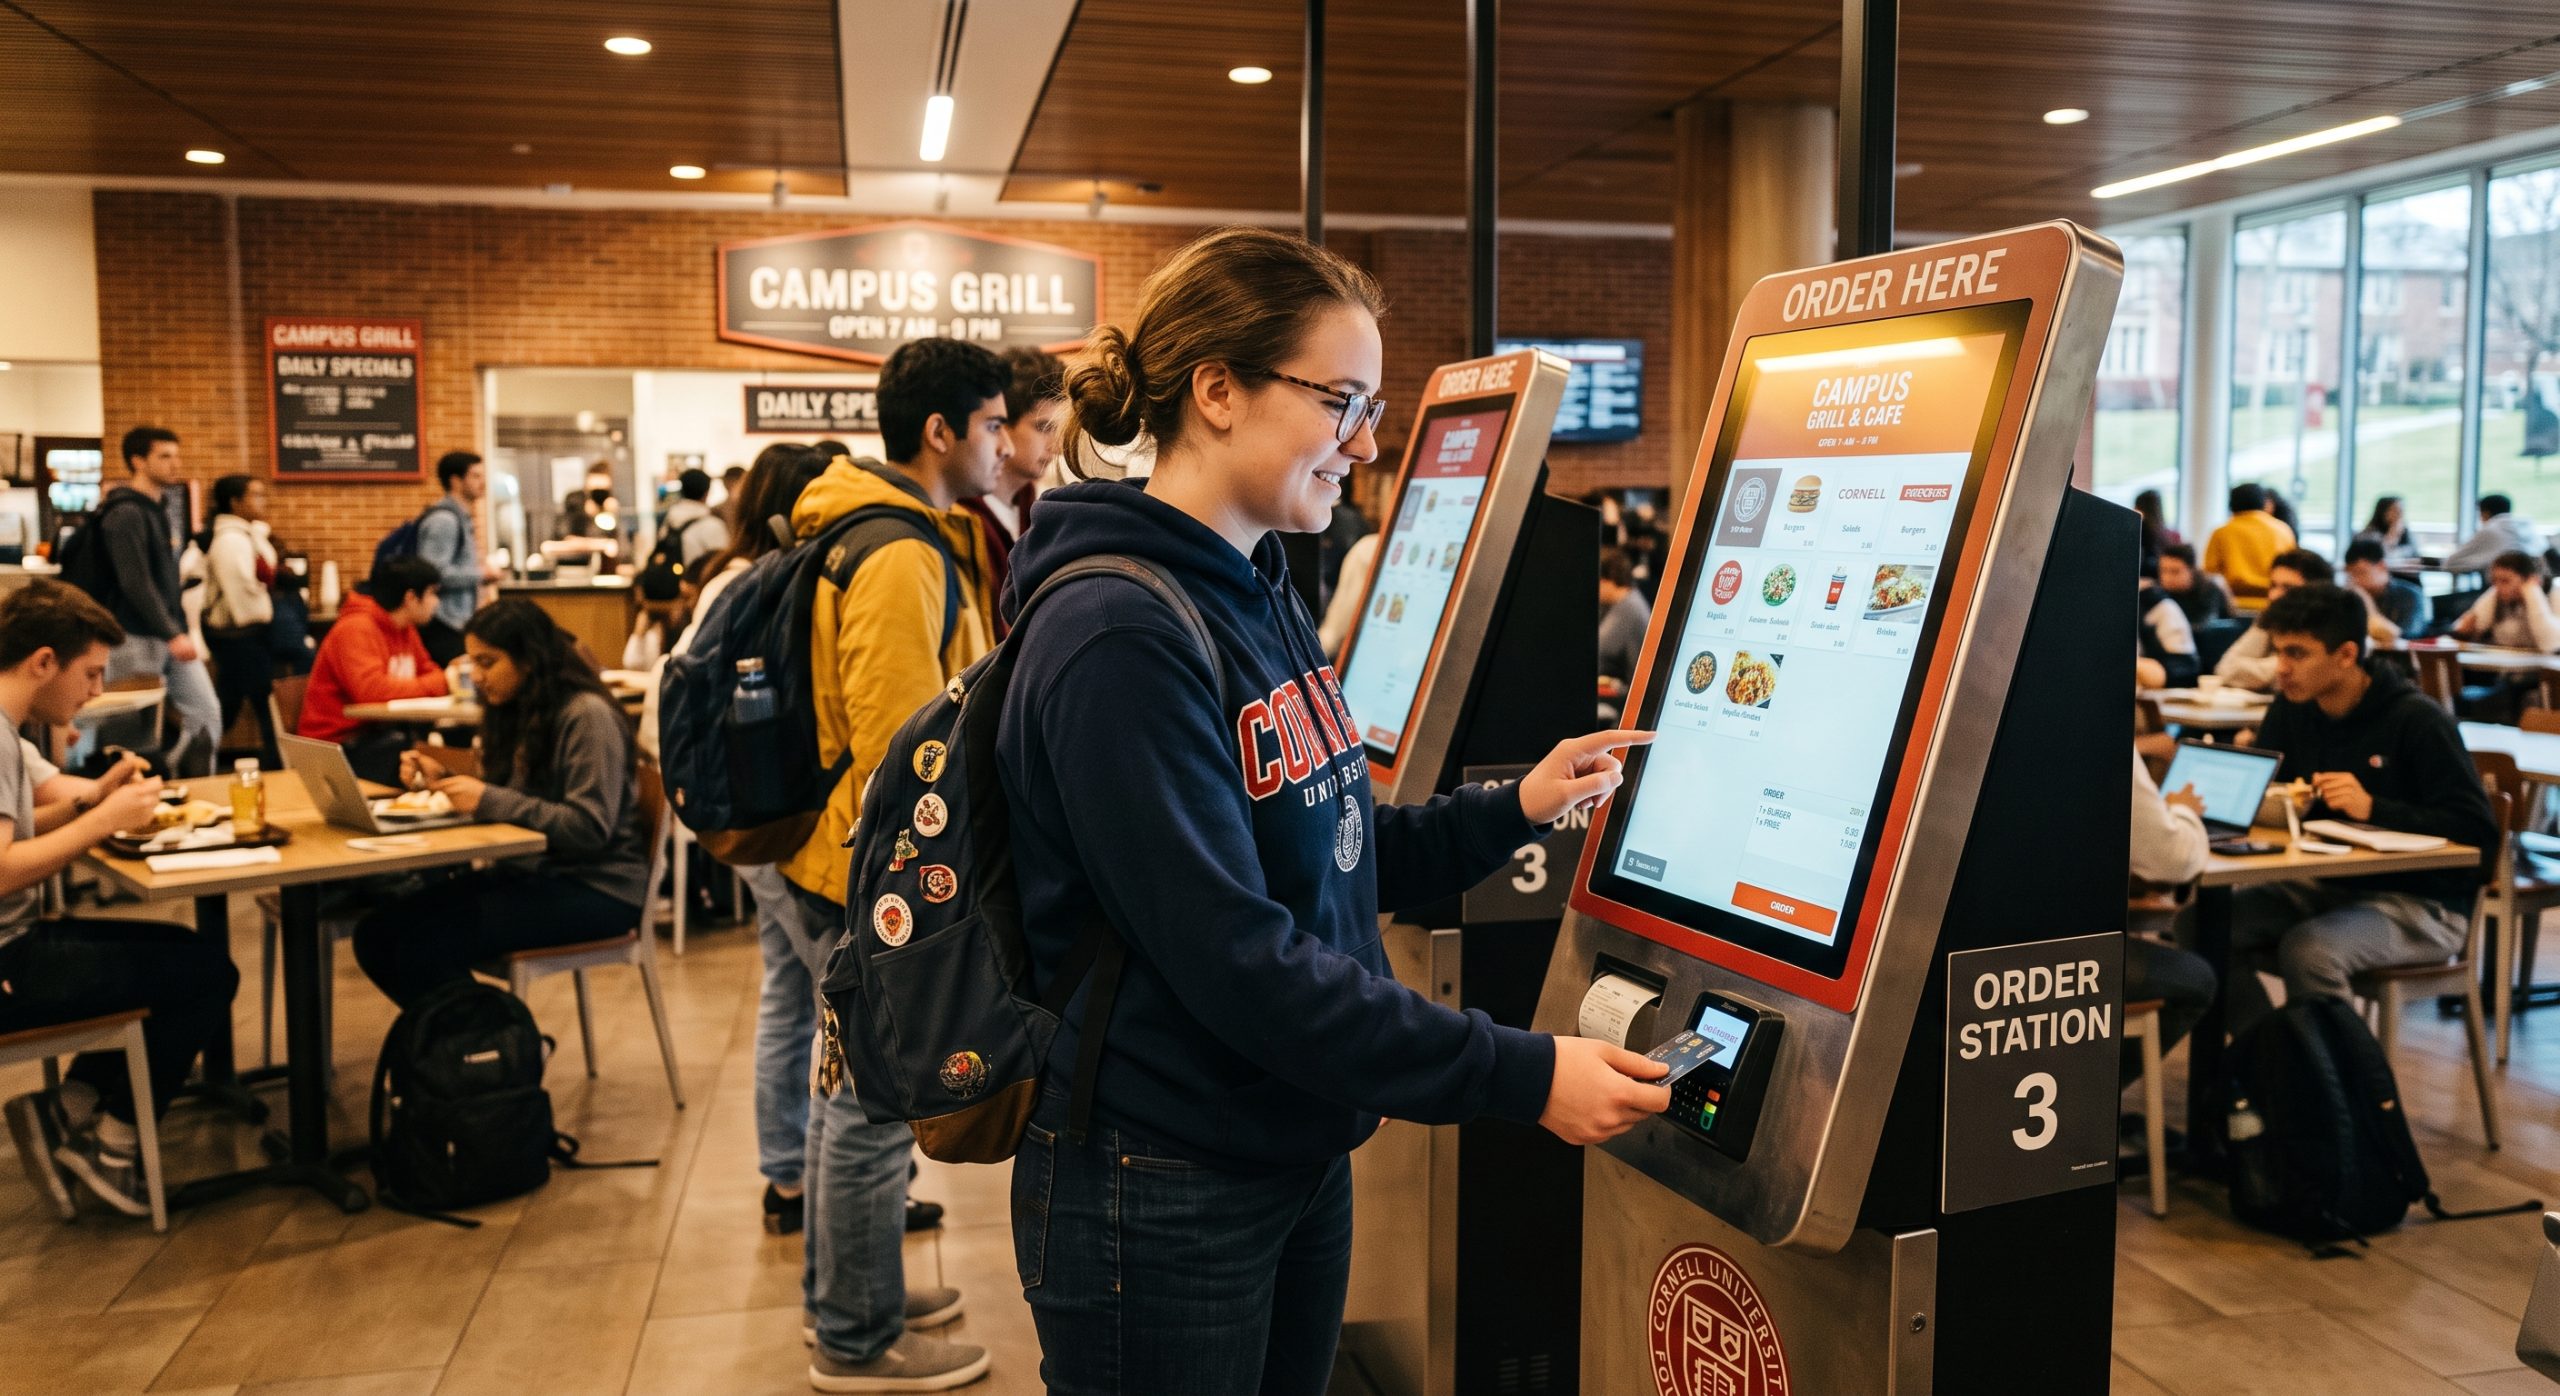
    There are 72.2 million (about 21 percent of the U.S. population) living in the United States, and college campuses are some of the most Gen Z-dense environments anywhere. And as a generation, Gen Z has a very clear opinion about how they want to order food. 

    What’s happening in campus dining halls right now isn’t a niche story about university food service; it’s a preview of what QSR and fast casual operators will be managing across their broader footprint within the next few years. The ordering habits being built on campuses today are the customer expectations operators will be navigating everywhere tomorrow.

    Campus Dining Is Under Real Pressure, And Technology Is Filling the Gap

    The numbers from campus dining tell an uncomfortable story for universities. Research from Grubhub Onsite shows that 60 percent of student food and beverage spending now happens off campus—up from just 30 percent a few years ago. Meanwhile, 36 percent of students aren’t using their meal plans at all. The traditional campus dining model is losing the student.

    Universities are responding with significant technology investment. Self-service kiosks, digital ordering platforms, smart micromarkets, and automated food stations are expanding across residence halls, student centers, libraries, and athletic facilities. In recent years, major food service operators like Aramark, Chartwells, and Compass Group are all deepening their campus partnerships with tech-forward dining programs. Chartwells, for example, brought Chick-N-Bap, Halal Shack, and other emerging brands to Binghamton University this year under a kiosk-integrated dining model.

    The labor dimension is familiar to anyone running a QSR operation. Campuses face the same staffing pressures that restaurant operators do, and kiosks are solving the same operational problem in both environments: maintaining throughput and service quality without requiring headcount that isn’t available.

    Gen Z Doesn’t Just Tolerate Kiosks—They Prefer Them

    This is the part brand operators should be paying close attention to. Gen Z’s preference for self-service ordering is a decisive one.

    91 percent of Gen Z customers prefer restaurants that offer kiosk services. 67 percent specifically prefer self-order kiosks, compared to 41 percent of the overall population. The reasons track closely with what makes campus dining so well-suited to the format: students cite the ability to customize their order independently as the primary advantage, pointing to the reduced pressure of self-paced ordering—no one waiting behind them, no one rushing their decision.

    On a busy campus, that matters even more. Students moving between classes have limited time and high expectations. A kiosk that lets them browse, modify, and pay in under two minutes isn’t a convenience—it’s the baseline they’ve come to expect. By comparison, the counter feels like friction.

    This generation didn’t grow up thinking of counter ordering as the default. Digital interfaces are their default. The campus environment makes that preference more visible because the audience is so concentrated.

    Campuses Are a Real-World Testing Lab for Brand Operators

    There’s something uniquely valuable about the campus dining environment from a data standpoint. Traffic patterns are dense and predictable. The customer base skews heavily toward a specific demographic. And the ordering behavior is observable in a way that’s harder to isolate in a typical QSR location with a more varied guest mix.

    What brands are learning on campuses: Gen Z audiences navigate menus visually, not verbally. They spend more time exploring customization options. They pay close attention to dietary and allergen information—and they expect it to be easy to find. They respond to featured items and visual merchandising in the kiosk interface in ways that translate directly into higher attachment rates on add-ons and upgrades.

    Those behaviors don’t stay on campus. Brand loyalty formed in college travels. The ordering habits a student builds at 19 follow them into their careers, their neighborhoods, and eventually their families. Brands that are introduced to students in a kiosk-first environment—and that deliver a good experience there—are building relationships that extend well beyond graduation.

    What This Means for Brand Operators Off-Campus

    The Gen Z cohort currently moving through university dining halls will be the dominant QSR and fast casual customer base within the next five years. The preferences they’re developing now—for digital ordering, for customization, and for low-friction self-service—are not preferences they’ll grow out of. 

    For brand operators, a few practical implications follow from this.

    Menu design increasingly needs to assume visual browsing, not verbal ordering. When a guest is navigating a kiosk screen rather than reading a board and talking to a cashier, item photography, clear descriptions, and intuitive layout do the selling. Operators who design menus for the counter and then port them to a kiosk are leaving performance on the table.

    Customization options matter more than they used to. Gen Z’s preference for building their order—not just picking from a preset—is a real purchasing driver. Kiosk interfaces that surface modifier options clearly and make customization feel easy, rather than buried, consistently outperform those that don’t.

    Dietary and allergen filtering has moved from a nice-to-have to an expectation. Campus dining has led on this because the population is diverse and vocal about it. The same expectation is arriving in QSR.

    The Operational Payoff Is Happening Now, Too

    The campus-to-QSR connection isn’t just a future story. The case for kiosk-first ordering is playing out in real numbers today. When guests control their own ordering experience, they spend more. Bite Lift, Bite’s AI-powered upsell engine, drives a 20 percent or greater increase in average check size across Bite’s customer base—a consistent result that reflects what happens when a guest has the time and the interface to explore their options without pressure.

    Order accuracy improves. Labor efficiency improves. And the guest experience improves for the segment of customers—increasingly the majority—who prefer it.

    The campus dining shift is already underway. Universities are investing in the infrastructure, food service operators are building the partnerships, and Gen Z is voting with their orders. The question for brand operators isn’t whether this shift is coming to their locations. It’s whether they’re building toward it now or planning to catch up later.

    If you want to see how Bite helps brands build kiosk-first operations that are ready for where guests are headed, we’d love to show you at getbite.com/demo.

  • Your Summer-to-Fall Operations Checklist: What Proactive Operators Do in August

    Your Summer-to-Fall Operations Checklist: What Proactive Operators Do in August

    August has a way of sneaking up on you. The summer rush is still going, your team is stretched, and fall feels like it’s a few weeks out until suddenly it isn’t. Before you know it, school has started, your labor pool has shifted, and the window to get ahead of the transition has closed.

    The good news: a little proactive planning in August goes a long way. Operators who take the time now to review their data, shore up their staffing, and get their fall menus locked in consistently come into September in a stronger position, with less scrambling and more margin for the things that inevitably don’t go as planned.

    Here’s a checklist worth running through before the month is out.

    1. Mine Your Summer Data Before the Season Closes

    Summer is one of the richest data windows of the year with high volume, extended hours, LTO testing, and concentrated foot traffic. Don’t let that data go unseen. Here’s how to ensure it doesn’t.

    • Pull daypart performance by location: where did you over- and under-index vs. the prior year?
    • Audit item-level sales: which LTOs earned their right to be on the menu? Which didn’t?
    • Review promotional attachment rates: which combos and upsells actually converted?
    • Flag recurring patterns. The locations that consistently outperformed (or struggled) in summer will likely do the same in fall.

    2. Get Ahead of the Staffing Cliff

    Every August, high school and college students cut hours as school resumes. Operators who plan for this come into September well-staffed. Operators who don’t spend the first month of fall short-handed, playing catch-up. Here’s how to prevent it.

    • Review your last two to three fall schedules: where did gaps appear, and in which dayparts?
    • Start recruiting now. Six to eight weeks before peak fall volume.
    • Tap local colleges, culinary programs, employee referrals, and returning seasonal hires.
    • Cross-train existing staff while you still have summer team overlap. It’s significantly harder after the cliff hits.
    • Adjust your schedule template: weekday traffic dips as families settle into school routines, weekend and evening demand picks up. Your fall schedule should reflect that, not carry over from summer.

    3. Lock In Your Fall Menu Before September

    The window between too early and too late is narrow. Operators who have fall menus configured, tested, priced, and trained before September are live on Day 1.

    • Confirm ingredient sourcing for seasonal items. Lead times matter more in fall than summer.
    • Audit every combo, modifier, and price point for accuracy across all ordering channels.
    • Update digital menus, menu boards, and any kiosk or app interfaces before the items go live.
    • Train staff on new items now, while you still have your full summer team on the floor.
    • Set a go/no-go date for fall menu launch. Give yourself a hard deadline, not a soft target.

    4. Rethink Your Daypart Strategy for Fall Routines

    Summer daypart patterns are not fall daypart patterns. Back-to-school changes when guests show up, how long they stay, and what they want.

    • In the mornings, commuter traffic returns. Reassess staffing and prep volume for breakfast and early lunch.
    • At dinner times, families on school-night schedules want speed, not discovery. Review kitchen throughput and ticket times for the 5–7 pm window.
    • As for late-night hours, expect a meaningful drop in covers for most concepts.  Plan for it rather than reacting to it in October. 
    • Adjust your staffing model to match the new traffic shape before the school year starts, not after.

    5. Set Your Fall Benchmarks Before the Season Starts

    Without benchmarks set in advance, fall performance becomes a December post-mortem instead of a mid-season management tool.

    • Set location-level targets for average check, traffic by daypart, and LTO attachment rates.
    • Establish baselines from your summer data review.
    • Align your team on what a successful fall looks like before it starts.
    • Confirm all technology—digital ordering, loyalty, scheduling tools—is configured and stable before peak fall volume arrives; troubleshooting a new integration during the September rush complicates a typically manageable transition.

    One Last Thing

    No amount of August planning makes September completely smooth. There will always be something that doesn’t go as expected. But operators who take the time now to review their data, get their teams ready, and lock in their menus tend to navigate those surprises from a stronger position. The goal isn’t a perfect transition. It’s giving yourself and your team the best possible foundation before fall hits.

    If you’re curious how Bite can help with the operational side of that transition—from menu updates to kiosk order data that informs smarter decisions—we’d love to show you what’s possible. Reach out at getbite.com/demo.

  • Chicken Is Fast Food’s Hottest Category. It’s Also the Perfect Fit for Kiosk-First Operations.

    Chicken Is Fast Food’s Hottest Category. It’s Also the Perfect Fit for Kiosk-First Operations.

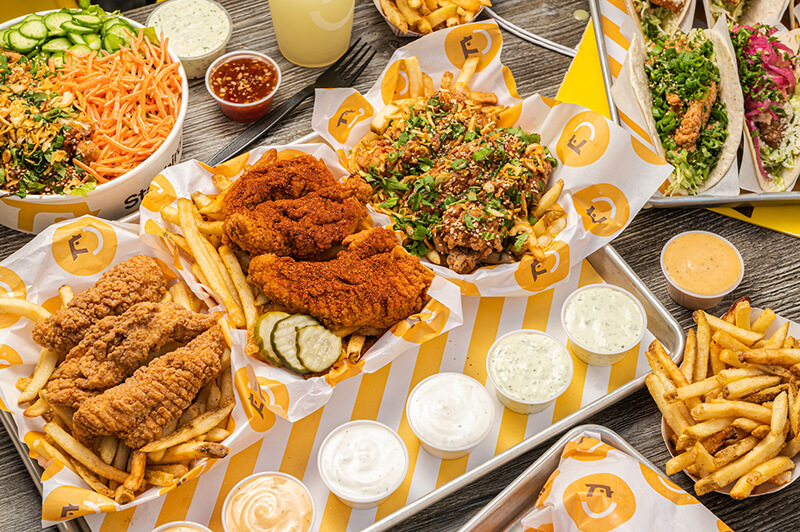
    While burger chains grew just 1.4 percent in 2024, chicken-centric QSRs grew nearly 9 percent. Needless to say, the category is booming. The brands pulling ahead aren’t just riding that wave—they’re building operations designed to scale it. And increasingly, that means going all in on kiosks.

    Chicken’s Moment Is Here (And It’s Not a Blip)

    The numbers tell a clear story. According to Datassential, the limited-service chicken segment is now the fastest-growing major QSR category by unit count, expanding at a 4.4 percent annual rate with sales reaching $55.24 billion in 2025. Chicken now accounts for roughly 12 percent of all U.S. chain restaurant sales, up from 7 percent in 2015—a share gain that would be staggering in almost any other category.

    QSR Magazine’s 2026 QSR 50, the industry’s annual benchmark for chain performance, reinforces why. Wingstop posted $4.8 billion in 2024 sales with 20 percent same-store sales growth and 278 net new units. Chick-fil-A added 178 net new units in 2025 alone. These aren’t outliers. They’re indicators of where franchise capital and consumer attention are flowing.

    The momentum is holding even as the broader fast-food sector struggles. Placer.ai data shows chicken chains were among only three QSR segments to grow visits in the first half of 2025, even as burger traffic fell 1.7 percent and sandwich concepts dropped more than 3 percent.

    Investments follow the consumer data. 

    All four have heavily invested in kiosks to meet their customers’ preference in ordering.

    There’s a more nuanced picture beneath the headline growth, though. Foot traffic per location has declined across the category as brands have raced to open units. What that signals: raw expansion alone doesn’t protect margins. The operators positioning themselves to win long-term are building better unit economics, not just more units. Kiosks are a meaningful lever in how they’re doing it.

    Why Chicken Menus Are Built for Kiosk Ordering

    Not every restaurant category benefits equally from kiosks. Chicken concepts do.

    The reason is menu architecture. Chicken concept menus are customization-heavy by nature: spice levels, sauces, bone-in or boneless, sandwiches or tenders, combo configurations, and seasonal LTOs. 

    Image courtesy of Starbird Chicken.

    At a front counter, that complexity creates friction. A guest takes longer to decide, the cashier slows to accommodate, and the line backs up. On a kiosk, that same complexity becomes an asset. The guest can browse, explore options, and modify their order at their own pace, all while the visual merchandising does the selling that a counter employee simply can’t replicate under volume.

    This matters especially for culturally rich menus. Jollibee and Bonchon bring globally influenced flavor profiles with nuanced modifier options—the kind of menu that benefits enormously from a visual, self-guided ordering experience where guests can learn as they order, not just transact.

    There’s a throughput argument, too. Chicken concepts often see compressed, high-volume windows at lunch and dinner. Kiosks absorb order volume independently, reduce the queue, and give kitchens more predictable ticket flow without requiring additional front-of-house labor.

    Starbird Built the Playbook

    Starbird Chicken is the clearest proof point the industry has for what a kiosk-first chicken concept looks like in practice.

    The Silicon Valley-born chicken brand began piloting Bite kiosks in 2019. When COVID hit six months later, they accelerated the rollout—deploying kiosks outside locations as a contactless ordering solution. What started as a response to circumstance became a strategic advantage. Today, Starbird operates three to four Bite kiosks in over a dozen of its locations, and is designing new restaurants with kiosks as the primary ordering method.

    Video courtesy of Starbird Chicken.

    The results are measurable. Between 60% and 70% of all in-store orders at Starbird now flow through Bite kiosks. And the platform has become something beyond an ordering tool—it’s their primary guest data acquisition channel.

    By integrating Bite kiosks with Attentive’s SMS platform, Starbird grew their subscriber list 6X in just six months. Of their 136,000 total SMS subscribers, more than 108,000 — nearly 80%—opted in via kiosk. Those kiosk-acquired subscribers have become their highest-performing SMS audience.

    “Integrating Bite’s kiosk technology with Attentive has been a game-changer for us,” said Casey Hilder, Director of Marketing at Starbird. “It’s allowed us to build a stronger connection with our customers, delivering timely, personalized messages that enhance their experience and keep them engaged with the Starbird brand.”

    The Compounding Benefits: Check Size, Loyalty, Speed

    The financial case for kiosk ordering in chicken concepts compounds quickly.

    Bite Lift, Bite’s AI-powered upsell engine, analyzes each transaction in real time and surfaces contextual recommendations—a sauce upgrade, a larger combo, an add-on that pairs with what’s already in the cart. Across Bite’s customer base, Bite Lift consistently drives a 20 percent or greater increase in average check size. At a chicken brand averaging a $12 to $16 ticket, that lift adds up fast across a multi-unit footprint.

    Order accuracy improves as well. Guests entering their own orders—especially complex, multi-modifier ones—eliminate the miscommunication that causes re-fires and comps. In a category where margins are already under pressure from ingredient costs and labor, removing that friction from the kitchen is material.

    Then there’s the loyalty flywheel. Starbird’s experience shows that kiosks are an underutilized opt-in channel. Guests who are engaged enough to visit in-store are exactly the audience brands want in their SMS and loyalty programs. The kiosk catches them at the right moment, in the right context.

    Building for the Category’s Next Chapter

    The chicken QSR segment is still early in its expansion cycle. New units will continue to open, menus will get more complex, and competition for the same guest will intensify. The operators who build smarter infrastructure now will outperform those who try to retrofit it later.

    That means designing new locations with kiosks as primary ordering channels. It means using kiosk data to understand what guests actually order, which upsells convert, and which LTOs are working in which markets. And it means treating the kiosk as a guest relationship tool, not just a transaction terminal.

    The brands already doing this—Starbird, Bonchon, Slim Chickens, Big Chicken, Jollibee—are some of the fastest-scaling names in the category. That’s not a coincidence.

    If you’re building or growing a chicken concept, see what Bite can do for your operation.

  • The Simmer Podcast—Maddy Shannon, Head of Product, SpotOn

    The Simmer Podcast—Maddy Shannon, Head of Product, SpotOn

    Maddy Shannon started her career as a Bain consultant before pivoting to the back office at some of the country’s most prestigious restaurants. It’s given her a nuanced perspective on the right balance of tech and hospitality that we appreciate. In this episode, we discuss personalization, good restaurant AI, and the modern point of sale system as the technological heart of a restaurant.

  • Kiosk End-of-Life Planning: A Guide for Multi-Unit Restaurant Operators

    Kiosk End-of-Life Planning: A Guide for Multi-Unit Restaurant Operators

    Most multi-unit operators evaluate kiosk hardware on upfront cost and feature set. What happens in year four when the payment device falls out of compliance? Or what about year six when the printer manufacturer sunsets the model running across 60 locations? It’s a point that rarely makes it into that conversation.

    The kiosk ages. The technology inside it moves faster than the case that houses it. And by the time a component reaches end of life (EOL), the options available to an operator are far more limited than they would have been with a year’s notice. Operators who think about this early have choices. Operators who think about it after something breaks mostly don’t.

    A Kiosk Is a Long-Term Operational Asset

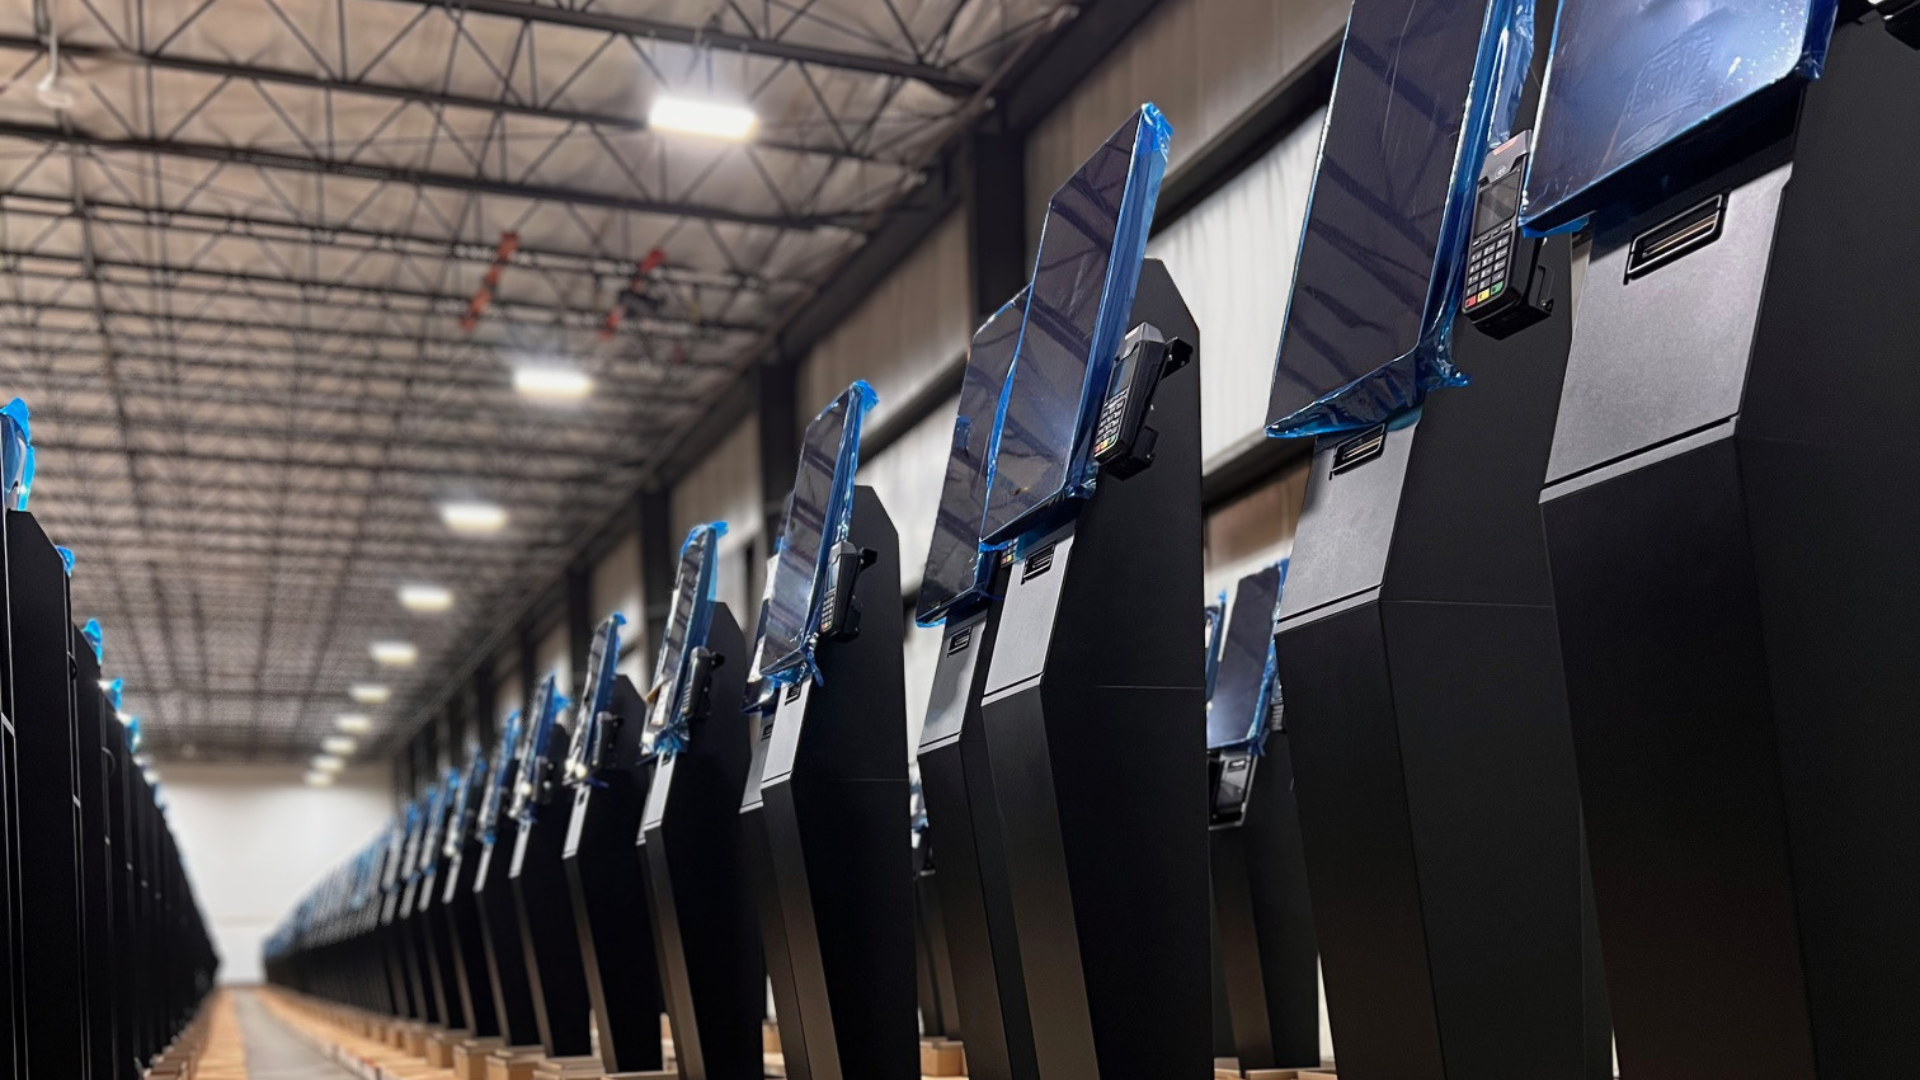
    A kiosk that goes live today will likely still be physically standing in seven to ten years. The case itself is the most durable part of the system. What changes—on its own timeline, independent of anything the operator controls—is everything inside it.

    Jared Epstein, Account Executive at Frank Mayer and Associates, puts it directly: “A kiosk is not just a one-time hardware purchase, rather a long-term operational asset that needs to support years of software updates, payment changes, peripheral refreshes, service requirements, and evolving customer expectations.”

    That changes how operators should think about what a kiosk actually costs. The purchase price is the entry point. The real question is what it takes to keep the system running well over the full life of the deployment, and whether the hardware was designed with that in mind.

    What End of Life Actually Means Across an Organization’s Fleet

    EOL is a layered set of timelines that rarely sync up, and each layer carries its own risk.

    Payment devices are the most visible example. EMV compliance, NFC certification, contactless payment standards—these cycles are driven by card brand mandates and security requirements, not by the operator’s schedule. A payment device that was fully certified at deployment can fall out of compliance before the rest of the kiosk shows any signs of wear.

    Epstein identifies the full range of components in play: “Payment devices, for example, can move through EOL cycles every few years due to compliance, security, or certification requirements. Printers, scanners, ADA keypads, cameras, and other peripherals can also change over time.” 

    Each one has its own manufacturer roadmap, its own parts availability window, and its own potential to force a reactive decision if it isn’t tracked ahead of time.

    Cybersecurity adds another layer. Older operating systems eventually lose vendor support, which means security patches stop coming. For operators running kiosks that handle payment data or customer information, that’s a compliance exposure that compounds quietly over time.

    Modular Design Is the Difference Between a Swap and a Full Replacement

    How a kiosk is built determines how much an operator can handle without replacing entire units. The design decisions made before a deployment have direct consequences years later.

    The goal is simple: components that are likely to need replacing before the case does should be installed in a way that lets them be swapped out independently. Epstein describes how Frank Mayer approaches this: “Wherever possible, critical components should be mounted with removable or modular brackets so they can be replaced, upgraded, or retrofitted without requiring an operator to replace the entire kiosk fleet.”

    In practice, that means payment devices, printers, scanners, and other peripherals are installed with serviceability in mind, so that replacing one part doesn’t turn into a whole-unit problem. Frank Mayer’s brackets are engineered to accommodate future changes and can typically handle new devices unless the new device is a dramatically different size or shape.

    That limit is worth keeping in mind. Modular design reduces exposure, and it works best alongside proactive planning—not as a substitute for it.

    Lifecycle Planning Starts at Deployment

    The most expensive EOL situations are the ones that come as a surprise. When a component is already discontinued, the options narrow fast: hunt for remaining stock, pay a premium for aftermarket parts, or replace units ahead of schedule. None of those are easy outcomes when they hit across a large fleet at once.

    Epstein is direct about when this thinking needs to start: “From the start of a deployment, it is important to identify the products that could potentially go EOL and understand where these products are at in their lifecycle—this helps avoid surprises.”

    In practice, that means asking specific questions during vendor selection. What is the manufacturer’s support history on this component? What does their product roadmap look like? What happens to parts availability when this model is discontinued? Are there known successors, and will they fit the current mounting setup?

    These are straightforward questions. They just rarely get asked early enough.

    “The biggest mistake operators, or kiosk manufacturers, can make is treating EOL planning as something to deal with later,” Epstein says. “By the time a component is discontinued or unsupported, the operator may be forced into a rushed and expensive decision. Designing for that change from day one alleviates that, and selecting reliable components, understanding their lifecycle, and engineering for serviceability will really help save the operator and the kiosk at the end of the day.”

    The Software Layer Has to Keep Up

    Swappable hardware only solves part of the problem. A component change that triggers a months-long software integration project—or disrupts the guest experience in the process—wipes out most of the value that good hardware design was supposed to deliver.

    This is where the kiosk software provider matters just as much as the hardware vendor. Operators should ask the same hard questions of both.

    Lea Anne Roberts, SVP of Customer Experience here at Bite, frames it around what’s ultimately at stake: “At the end of the day, a kiosk is a hospitality touchpoint. When hardware starts to degrade—slow screens, unresponsive payment devices, peripherals that fail mid-transaction—it doesn’t just create an operational headache. It breaks the guest experience at exactly the moment you’re asking them to trust the technology. Lifecycle planning is really about protecting that experience for the long haul. The software has to be built to absorb hardware changes without the guest ever feeling the disruption.”

    Whether the software works with today’s hardware matters less than whether it’s built to flex when that hardware changes without forcing the operator to replatform, reprice, or retrain staff every time a peripheral cycles out. Bite’s kiosk software is built with that flexibility as a design principle, not a retrofit.

    A Framework for Assessing Lifecycle Risk

    Before the next deployment decision—or when auditing an existing fleet—these are the questions worth getting clear answers on.

    What is the EOL timeline for each major component currently deployed: payment devices, printers, scanners, display hardware, and the underlying OS? Does the hardware vendor offer modular replacement options, and what are the realistic limits when a new device looks significantly different from the old one? What is the manufacturer’s track record on parts availability after a product is discontinued? Is the software platform built to handle peripheral changes without a broader integration project? And is there a multi-year budget that accounts for component refresh—not just the initial purchase?

    Operators who work through these questions before signing have options. Operators who surface them after something breaks have far fewer.

    Planning for Year Seven Starts on Day One

    Kiosk deployments are long-term commitments. The operators getting the most out of them—in throughput, check lift, and guest experience—treat them that way from the start.

    Think about serviceability when selecting hardware. Track component timelines before they become urgent. Make sure the software is built to absorb change. The kiosks that perform well in year seven are the ones that were planned for year seven from the beginning.

  • The Simmer Podcast—Randall Hom, Co-Founder & CEO, Hostie

    The Simmer Podcast—Randall Hom, Co-Founder & CEO, Hostie

    Hostie, an AI-powered “restaurant concierge” headquartered in the Bay Area, just announced $12 million in Series A funding. Randall Hom is Hostie’s co-founder and CEO. He’s also a San Francisco restaurateur who knows firsthand the challenges of engaging with human guests in the age of artificial intelligence. In this episode, we discuss guest preferences and engagement, AI for restaurants and “the city.” Which city? You’ll have to listen to find out.

  • Is Your Restaurant Ready for Summer? A Pre-Season Checklist for Operators & IT Teams

    Is Your Restaurant Ready for Summer? A Pre-Season Checklist for Operators & IT Teams

    Most multi-unit operators don’t have a formal pre-season readiness process. They have a general sense of what needs to happen and a reasonable confidence that it’s getting done. That confidence is hard to verify across ten locations. Much harder across fifty.

    The problem with informal preparation isn’t intent—it’s that there’s no way to know what’s been missed until volume exposes it. A kiosk that’s not intercepting guest traffic. An upsell sequence that was never updated for the summer. A seasonal hire on the register during a Saturday lunch rush. These aren’t failure-of-effort problems. They’re failure-of-verification problems.

    This checklist is built for cross-functional ops and IT teams who want a structured way to confirm readiness across every location before summer traffic peaks. Not a reminder of things to think about—a tool to actually run through, assign by role, and track to completion.

    How to Use This Checklist

    The items below are organized into two tracks: Operations and Technology. In practice, these aren’t fully separate—a kiosk placement decision is both an ops question and a tech question—but the ownership typically is. Assign the Operations track to your regional ops lead or general manager at each location. Assign the Technology track to your IT or tech lead.

    Work through both tracks at each location, not just at the locations you’re most worried about. Peak season performance variance across a portfolio often has less to do with overall brand strength and more to do with which specific locations got the pre-season attention and which didn’t.

    The goal isn’t to complete the checklist once at the brand level. It’s to complete it at every location.

    Operations Track

    Floor and Queue Management

    • Walk each location during a high-volume period and map guest flow. Where do guests slow down after entering? Where does the line form when the lobby fills? Where does the ordering process visibly stall? This walk surfaces problems that don’t show up in transaction data—congestion patterns, dead zones, and friction points that only become visible when the space is actually under pressure.
    • Confirm kiosk placement intercepts natural guest traffic from the entrance. A kiosk positioned off to the side of the main traffic flow gets ignored regardless of how well it’s configured. The placement question isn’t whether guests can find the kiosk—it’s whether the kiosk is positioned where guests naturally decelerate after entering. That’s where adoption happens. Per Bite’s platform guidance, placement relative to entry traffic patterns is one of the highest-impact variables in kiosk adoption rates.
    • Audit signage for ordering flow clarity. Can a first-time guest navigate from entry to order to pickup without asking a staff member for direction? If not, the signage isn’t doing its job. This matters especially during summer, when tourist and non-regular traffic is higher than at any other time of year.
    • Confirm queue barriers and lobby management tools are in place and positioned correctly. Queue management infrastructure—barriers, stanchions, floor markers—doesn’t need to be elaborate. It needs to exist and be positioned where congestion actually forms, not where it’s convenient to store it.

    Staffing and Role Deployment

    • Identify cross-training gaps by role and location. Which critical roles—expo, food running, counter backup—have no cross-trained coverage if someone calls out? Map those gaps now, before volume makes cross-training impractical. With 77% of operators still citing recruiting and retaining employees as a leading challenge, according to the NRA’s 2025 State of the Restaurant Industry report, most operations are heading into summer without the staffing depth they’d prefer. Cross-training is the primary way to build flexibility into a team that may not be at full strength. 
    • Confirm your seasonal hire deployment plan assigns new staff to lower-stakes roles. New hires have the steepest learning curves and the highest error rates. The register during a summer lunch rush is not the right place for them. Assign seasonal staff to food running, bussing, expo support, and lobby management—roles where execution matters but error consequences are lower.
    • Confirm staffing schedules are built against daypart-level transaction data, not last year’s general patterns. Summer volume isn’t uniform. Tourist-adjacent locations see different patterns than commuter corridors. Pull your location-level transaction data by daypart and day of week before setting schedules. Staff for the hard windows, specifically, not for an average week.

    Menu and Speed of Service

    • Audit your summer LTOs for prep time and volume implications.
      A new item that performs well at moderate volume can become a kitchen liability during a peak rush. Before promoting any summer LTO, stress-test its prep time under high-volume conditions. If it can’t come off the line cleanly when the kitchen is at capacity, it shouldn’t be a featured item during your busiest weeks.
    • Identify items that consistently generate order errors or kitchen confusion. Pull your order accuracy data by item and location. Which modifications generate the most errors? Which items produce the most voids or remakes? Fixing those before summer means fewer disruptions when volume is highest and staff bandwidth is lowest.

    Technology Track

    Kiosk Configuration

    • Review kiosk screen configurations for summer menu alignment.
      Are featured slots updated to reflect your summer menu? Are you promoting items that are high-margin and fast to prepare, or items that were configured months ago and never updated? Screen configuration should be treated as an active merchandising decision, not a set-it-and-forget-it setup.
    • Confirm upsell sequences are configured for daypart context.
      A lunch sequence optimized for speed should look different from a dinner sequence optimized for check size. Guests visiting in the evening have more time, are more receptive to premium add-ons, and represent a higher check-size opportunity. Bite’s AI-powered upsell logic matches the right add-on to the right order at the right moment—but only if the underlying configuration reflects your actual daypart strategy.
    • Audit upsell attachment rates by location and identify underperforming configurations. Which locations are seeing strong check lift and which aren’t? Configuration differences are usually the explanation. Identify the gap before peak season, not after. Bite operators consistently see 20%+ average check lift across their kiosk deployments—locations running significantly below that benchmark are leaving revenue on the table.
    • Verify kiosk hardware is serviced and functioning across all locations. A kiosk that goes down during a Saturday lunch rush doesn’t just take an ordering channel offline—it creates lobby congestion, increases counter load, and degrades the guest experience at exactly the moment it matters most. Run a hardware audit at every location before volume peaks. Don’t find out something’s broken when it costs you the most.

    Analytics and Visibility

    • Confirm analytics access for regional and corporate teams. Who can pull transaction data by location and daypart? If the answer is “only the person who set up the account,” that’s a visibility problem that will limit your ability to make mid-season adjustments. Bite’s Sales and Analytics Dashboard gives corporate and regional teams location-level and item-level data—but access needs to be configured and confirmed before the season starts.
    • Establish a mid-season data review cadence. Peak season generates more transaction data than any other period. Build in a scheduled review—weekly or bi-weekly—to check upsell attachment rates, daypart performance, and ticket time trends by location. The operators who come out of summer with better margins aren’t the ones who reviewed the data in September. They’re the ones who acted on it in July.

    System Readiness

    • Confirm all menu updates are live across every location before summer LTOs launch. Stale kiosk screens—showing last season’s featured items, out-of-date pricing, or removed menu items—erode guest trust and create ordering friction. Verify that menu pushes have propagated correctly to every location, not just the ones you’re watching most closely.
    • Monitor and update KOR (Kiosk Order Ready) dashboard alerts.
      The lunch rush is going as planned, but at the end of the day, you notice that the number of orders from kiosks dipped 50% from previous days. What caused it? Don’t wait to find out hours later that a kiosk was off or had a software or hardware issue. Bite’s KOR dashboard allows operators to see the status of their kiosks in real-time, allowing them to troubleshoot issues to get back online. Administrators can set up email and sms alerts to get the most up-to-date reporting on the entire kiosk fleet, whether at the store or organization level.

    The Brand/Operator Coordination Layer

    For franchise systems, summer readiness isn’t just a location-level problem—it’s a coordination problem between brand and operator. Brand designs the menu, sets the technology configuration, and establishes the guardrails. Regional operators own the execution. The gap between those two layers is where peak season problems most reliably live.

    This checklist is most effective when it’s completed at the location level and reviewed at the regional level. Where configuration gaps exist—upsell sequences that were never updated, kiosk placement that doesn’t match brand standards, analytics access that hasn’t been provisioned—the fix often requires both parties acting. Flag those items for escalation rather than leaving them to individual location discretion.

    As Portillo’s noted in QSR Magazine’s 2025 operator roundup, the impact of “thoughtfully connected systems—from digital menu boards and self-service kiosks” depends on those technologies working together, not in isolation. That integration is a brand-level responsibility. Confirming it’s actually in place at every location is an operator-level one.

    Summer rewards preparation. The teams that run through this checklist in May come out of August with better margins, better guest scores, and a clearer picture of where to focus heading into fall.

  • The Simmer Podcast—Joshua Sharkey, Founder & CEO, Meez

    The Simmer Podcast—Joshua Sharkey, Founder & CEO, Meez

    Kristen and Brandon have shaken out the cobwebs and are back with a new episode of The Simmer featuring friend-of-the-pod, Joshua Sharkey, founder and CEO of Meez, a culinary operating system and recipe management tool. Pre-Meez, Josh spent time in the kitchens of several restaurants, including New York’s Tabla and Bouley. In this episode, we cover recipe scaling and sourcing (and more nonsexy but totally essential back-office tech), plus a whole lot about AI and how it’s primed to change how we all interact with everyone and everything.